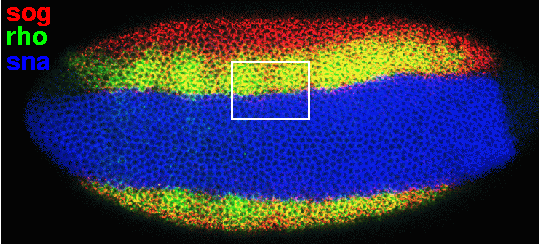
First, this low magnification view presents the ventral-lateral aspect of a late-blastoderm stage embryo, triple-stained for sog, rho, and sna mRNA:

Expressed in a broad band of cells along the ventral surface of the embryo, sna (blue) is a primary determinant of mesoderm development, which functions by repressing a group of neuroectoderm patterning genes, including rho (green) and sog (red) (reviewed in Rusch and Levine, 1996; Stathopoulos and Levine, 2002). Note the sharp border between the expression domains of sna and the other two genes. Sog expression extends further into lateral regions than rho, and, where they overlap in ventral-lateral cells, their combined signals appear in yellow. The white box indicates the approximate location of a field of nuclei from a younger embryo, double-stained for sog and rho:
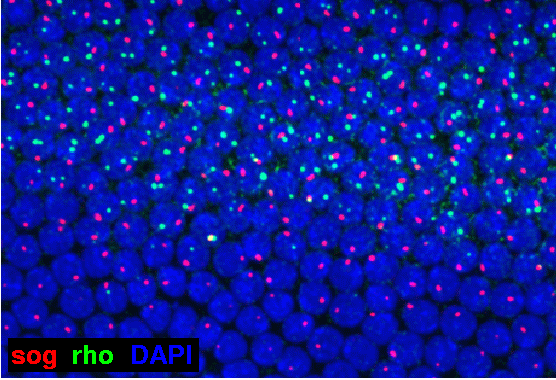
In this high magnification view, the nuclear dots of both rho (green) and sog (red) are clearly visible on a background of nuclei (blue) counterstained with DAPI. The mRNA channels are maximum projections of image stacks that encompass the full depth of the monolayer of nuclei. In the upper half of the image, many nuclei have two rho dots, but some have only one; in the lower half, where sna should be expressed, only very few, faint rho dots are present. On the other hand, sog dots appear both in the upper zone of nuclei along with rho, and also in the lower zone without rho; but no nucleus possesses more than one sog dot. The interpretation is as follows. The rho gene, located on chromosome 3L, is present as two alleles per nucleus, and where conditions are favorable for rho activation, some nuclei have commenced transcription at both alleles, and others at only one. The sog gene, located on the X chromosome, is present as only one allele per nucleus, because the embryo happens to be a male (other embryos of a similar age possess two sog dots per nucleus); and sog transcription can occur in the lower zone of nuclei where rho is effectively repressed by sna.
The visualization of nuclear dots can provide detailed information about the transcriptional states of individual nuclei. By color-coding nuclear dots according to the methods commonly used in cytogenetic M-FISH, recording the expression of many more genes per nucleus was made possible (Levsky et al., 2002).
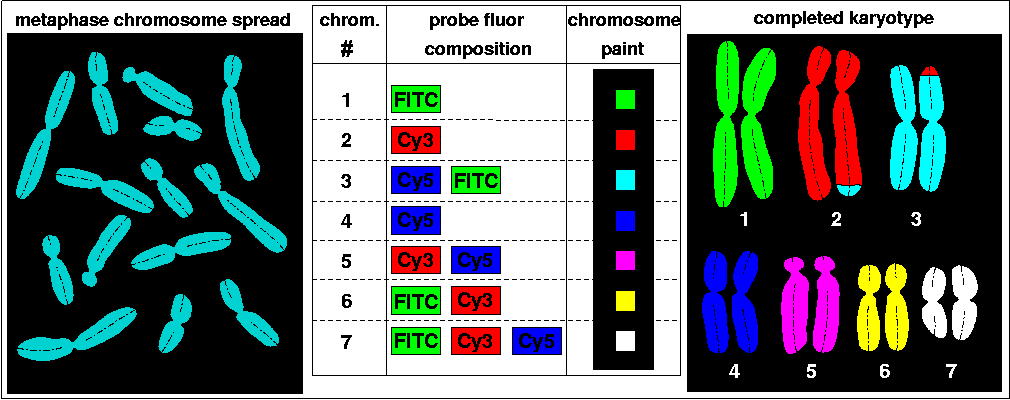
A metaphase chromosome spread is prepared on a slide from cells of an hypothetical animal possessing seven pairs of chromosomes (left). PCR amplification of whole chromosome templates, involving dUTPs modified with the spectrally distinct fluors FITC, Cy3, and Cy5, generates fluorescently labeled chromosome-specific DNA probes, and a mixture of these are then cohybridized to the metaphase chromosomes. For example, chromosome 1 probes labeled with only FITC are part of the mixture, whereas chromosome 6 probes labeled with both FITC and Cy3 are hybridized. Thus, with all the possible combinations of three fluors, up to seven different 'chromosome paints' can be created (middle). After hybridization and triple-channel imaging, each chromosome can then be identified based on its appearance in one, two, or all three image channels, and 'painted' with a unique color. For example, chromosome 6 should appear in the FITC and Cy3 channels, but not in the Cy5 channel. Specialized software performs these cross-channel boolean comparisons, and ultimately image segments displaying the identified and color-coded chromosomes are arranged into a completed karyotype (right). M-FISH analysis of this unfortunate individual has revealed that a reciprocal translocation between the tips of chromosomes 2 and 3 has occurred in one of its chromosome sets. The ability to distinguish up to five fluors, combined with probes specific for small sub-regions of chromosomes and sophisticated probe pool design, has enabled extremely high resolution mapping of aberrant human genotypes (e.g., Seidel et al., 2003). For a couple of in-depth descriptions of M-FISH, see Links and References.
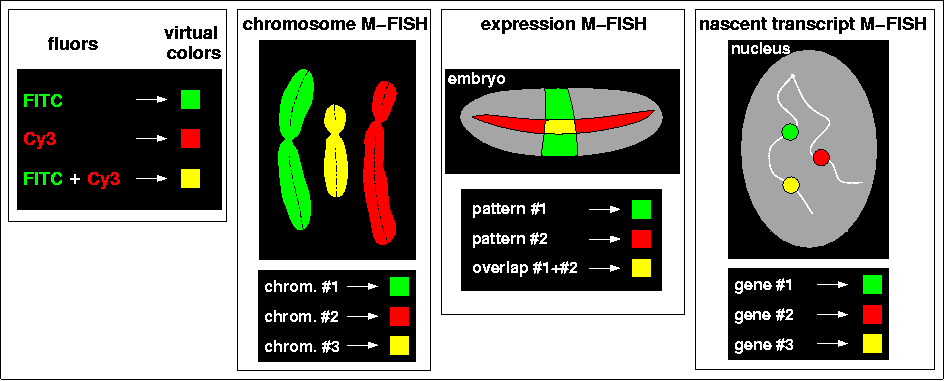
The combined signal of two spectrally distinct fluors can be represented as a third 'virtual color', just as the mixture of the two primary colors red and green appear to the human brain as 'yellow' (left). As explained above, chromosome M-FISH identifies separate metaphase chromosomes by distinguishing these virtual colors (second from left). However, in M-FISH for gene expression in the embryo, the overlap of two patterns must be represented by the third virtual color, making it unavailable to visualize the expression of a third gene (second from right). But because the nascent transcripts of genes occupy discrete volumes in the nucleus, the virtual coloring schemes established for chromosomal M-FISH can also be applied to the detection of gene expression on a per nucleus basis (right). As shown in the drawing of a nucleus, the Singer group (Levsky et al., 2002) labeled nuclear dots with these 'spectral barcodes', and was able to monitor simultaneously the expression of ten genes. This new technique was used to measure the differential response of genes to serum induction in a population of cultured cancer cells, and has the general potential to provide great insight into the connections between transcriptional states and cellular physiology.
To assess the feasibility of applying this technique to Drosophila embryonic development, we have done a simple experiment using the FISH protocol presented here, as illustrated in this diagram:
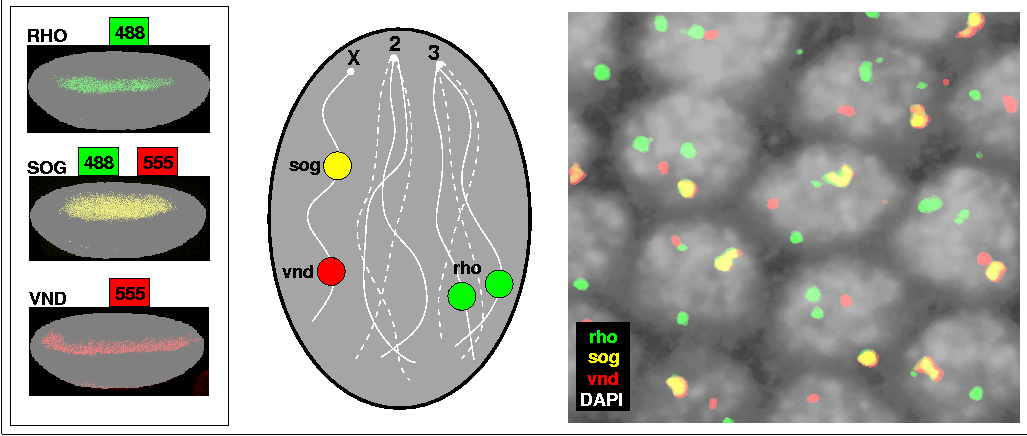
Rho, sog, and vnd are expressed in overlapping sets of cells in ventral-lateral regions of the embryo. DNP-labeled rho probe was visualized with Alexa 488, and BIO-labeled vnd probe with Alexa 555; sog was detected with a mixture of these two labels and fluors (left). A schematic drawing of a single male nucleus expressing all three genes represents the expected outcome of the experiment (middle): vnd and sog, both located on the X chromosome, should produce one red and one yellow nuclear dot, respectively; and rho, located on chromosome 3L, should produce two green dots. On the right, a small field of nuclei expressing all three genes conforms to this scenario. Nuclei were counterstained with DAPI and appear in grey; the mRNA images are flattened projections of confocal z-series spanning the entire depth of the nuclei, and have been processed with a size filter to remove all but the largest objects. The nuclear dots of all three genes can be unequivocally identified based on the simple color code.
Having established in principle that spectral barcoding could work in Drosophila embryos, the next step is to attempt to detect the expression of more genes with a deeper coding scheme. The potential for expansion of the number of barcodes is given by the formula 2F-1, where 'F' is the number of distinct fluorochromes employed. Thus, with 4 fluors, 15 genes could be scored; and with 5, 31 genes; et cetera (Levsky et al., 2002, supporting online material). However, for these larger number of genes, it is unclear how geometrical factors, such as the size and spacing of nuclear dots, will impede the collection of reliable data. Another technical challenge will be to distinguish nuclear nascent transcript signal from that of mature, cytoplasmic transcripts. Intron-specific probes that detect only primary transcripts (Knirr et al., 1999), and the identification of nuclear volumes with three-dimensional image segmentation algorithms (Ortiz de Solorzano et al., 1999, 2001) might help to solve this problem.
Previous: Alternative Methods for Fluorescent Detection